

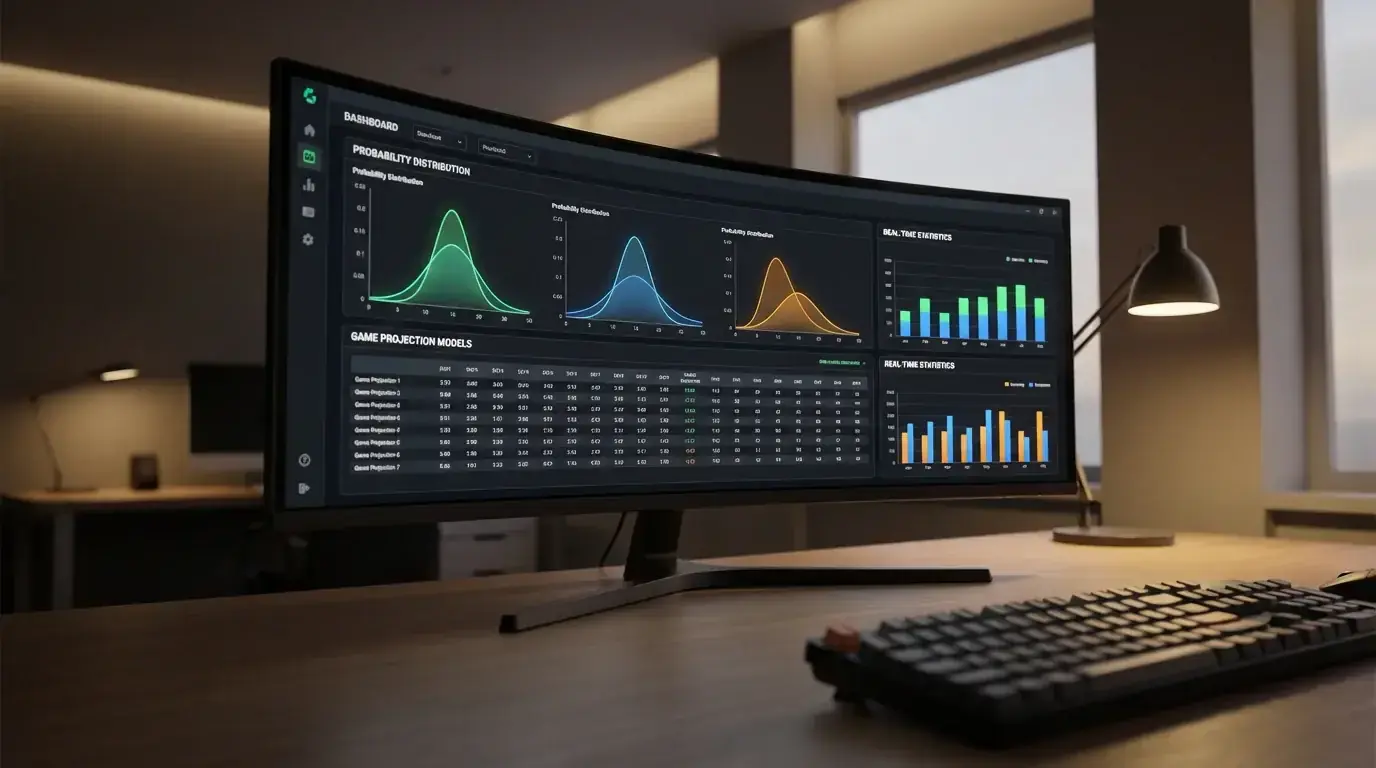
Computer picks sound authoritative. The algorithm says bet this team, so you bet this team. I followed that logic for an entire month during my second MLB season and lost money despite the model claiming a 58% historical accuracy rate. The experience taught me something crucial: a computer pick is only as good as the model behind it, and most bettors who follow computer picks have no idea what that model actually does or where its blind spots are.
This is not an argument against models — I build and use my own. It is an argument for understanding what models do, what they cannot do, and why blindly tailing someone else’s algorithm is not a strategy. The data revolution in baseball has produced extraordinary analytical tools, but those tools require a human operator who understands their limitations.
What Happens Inside an MLB Prediction Model
Nick Girsch has spoken about how there are always new data sources emerging and that staying ahead means understanding and using them effectively. That statement captures the engine behind every serious MLB model: data inputs, mathematical processing, probability outputs.
At the most basic level, an MLB prediction model takes inputs — starting pitcher metrics, team offensive stats, bullpen quality, park factors, weather data — and processes them through a mathematical framework to produce a win probability for each team. The output might say: Team A has a 57.3% chance of winning. If the bookmaker’s implied probability for Team A is 53%, the model identifies a potential +EV bet.
The inputs vary by model. Some rely primarily on pitching data (FIP, xERA, K/BB). Others weight offence more heavily (wOBA, wRC+, hard-hit rate). The best models incorporate both, along with park-specific adjustments and recent performance trends. What separates a useful model from a misleading one is how the inputs are weighted, whether those weights are derived from historical data or from the modeller’s assumptions, and how the model handles uncertainty.
A model that says “57.3% probability” without expressing uncertainty is lying by omission. The honest output is a range: “55-60% with a central estimate of 57.3%.” That range matters because it tells you how confident the model is in its own prediction. A narrow range suggests the inputs are clear and the matchup is well-defined. A wide range suggests ambiguity — maybe a pitcher is returning from injury, or a team recently overhauled its lineup. In ambiguous situations, a disciplined bettor passes rather than treats the central estimate as gospel.
Regression, Simulation, and Ensemble: Three Model Families
Not all models work the same way, and the family of model matters for how you should interpret its outputs.
Regression models are the simplest. They use historical data to find statistical relationships between inputs (pitcher FIP, team wOBA, park factor) and outcomes (win/loss). A regression model might find that for every 0.50 decrease in a starter’s FIP, the team’s win probability increases by 3.2%. These relationships are applied to today’s matchup to generate a prediction. Regression models are transparent and easy to audit, but they assume that the relationships found in historical data will hold in the current season, which is not always true.
Simulation models — Monte Carlo simulations, specifically — take a different approach. Instead of predicting a single outcome, they run the game thousands of times with randomised variables. Each simulation might vary the pitcher’s performance, the lineup’s hitting, and the bullpen usage based on probability distributions. After 10,000 simulations, the model counts how many times each team won and expresses the result as a probability. Simulation models handle uncertainty better than regression models because they explicitly model variance rather than averaging over it.
Ensemble models combine multiple approaches — perhaps a regression model, a simulation, and a machine-learning classifier — and average or weight their outputs. The logic is that different models capture different patterns in the data, and combining them reduces the overall prediction error. Most commercial MLB prediction services use some form of ensemble model, though they rarely disclose the specifics.
Why Computer Picks Alone Are Not Enough
Here is the uncomfortable truth about computer picks: even a perfect model cannot beat the market if the market has already priced in the same information. With 2,430 games per season feeding data back into both the models and the betting market, bookmakers are not standing still. Their algorithms incorporate the same publicly available data that most computer pick models use.
The edge, if it exists, lives in one of three places. First: proprietary data that the public does not have. Some models incorporate private pitch-tracking data, biomechanical analysis, or real-time injury intelligence that moves faster than public reporting. Second: a novel methodology that processes public data differently from the consensus. Most models use the same inputs; few process them in genuinely original ways. Third: speed. If a model can incorporate new information — a late lineup change, a weather shift, a pitcher’s pregame bullpen session report — faster than the market adjusts, it can capture value in the window between information release and line movement.
For a UK bettor without access to proprietary data or institutional-grade technology, the most realistic approach is using computer models as one input alongside your own analysis rather than as a standalone decision engine. I run my model every morning, note its picks, and then overlay my own evaluation of factors the model handles poorly — managerial tendencies, recent travel schedules, clubhouse dynamics, and the qualitative reads that data alone cannot capture. The model gets a vote, not a veto, in my MLB betting process.
