

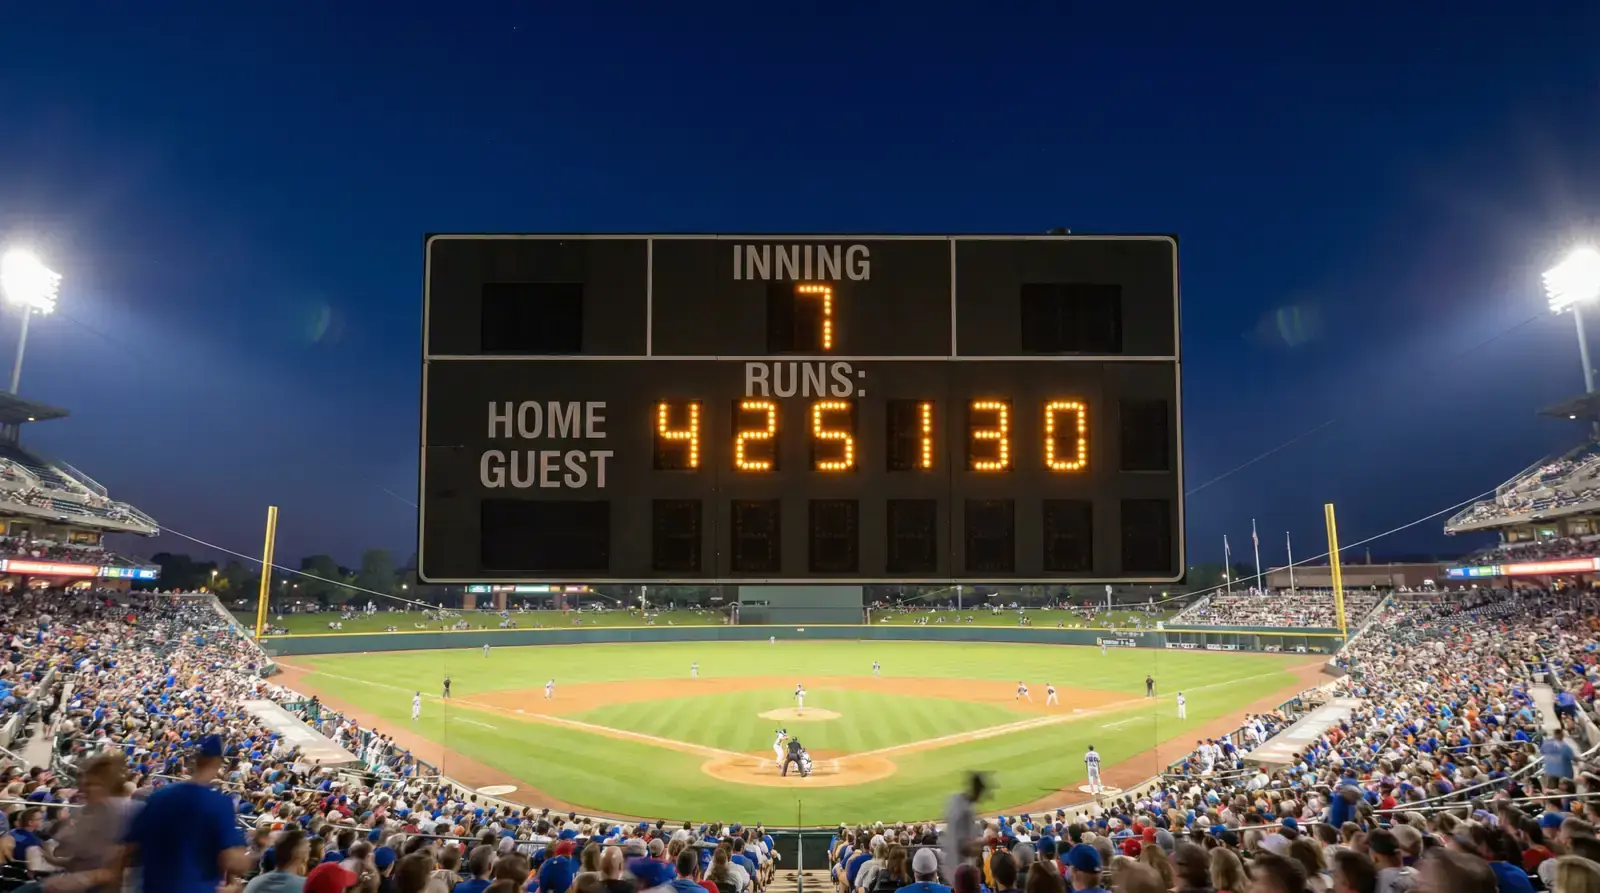
If you have ever bet over/under on goals in a Premier League match, you already understand the logic behind MLB totals. The bookmaker sets a line — say, 8.5 runs — and you decide whether the combined score will land above or below that number. The difference is scale: football totals revolve around 2.5 goals while baseball totals orbit 8 or 9 runs, and that wider scoring range creates more granularity, more variance, and frankly more opportunity for a bettor who knows where to look.
I have been betting MLB totals for the better part of nine years, and the market still surprises me. A game projected at 7.5 runs can explode into a 14-3 blowout because the wind shifted at Wrigley, or it can limp to a 2-1 pitchers’ duel because both starters found an extra gear. The job is not to predict the exact score. The job is to identify the spots where the bookmaker’s number does not account for the conditions you can measure. Average game duration dropped to roughly 2.5 hours after the pitch clock was introduced, but shorter games have not meaningfully reduced scoring — they have simply compressed it, which makes totals analysis more about intensity than time.
How Bookmakers Set MLB Totals Lines
Early in my career I assumed totals lines were set by some algorithm crunching pitcher stats and spitting out a number. The truth is messier and more interesting than that.
Oddsmakers begin with a base run expectation derived from each team’s offensive output, the starting pitchers’ run-prevention metrics, and a neutral park environment. That base number is then adjusted for the specific ballpark, the weather forecast, and historical trends for similar matchups. But here is the part most bettors miss: the opening line is also shaped by the book’s expectation of where the money will flow. Bookmakers are in the business of managing liability, not predicting scores. If they know the public hammers overs on nationally televised games, they might shade the opening total half a run higher than their raw model suggests, banking on that public bias to balance their book.
This means the opening total is not a pure expression of probability — it is a commercial product. The sharpest totals bettors I know spend as much time understanding the book’s motivations as they do studying pitcher splits. When you can identify a total that has been inflated or deflated to attract public action, you have found a structural edge that is independent of the game itself.
Totals lines in MLB are set in half-run increments (7.5, 8.0, 8.5, 9.0, and so on). Whole numbers matter because they create push potential — if the total is set at 8.0 and the combined score lands on exactly 8, your bet is returned. Some bettors prefer whole-number lines for that safety net; I generally prefer the half-run lines because they force a decisive outcome and the juice is often more favourable.
Weather and Park Factors That Swing the Total
A night game at Petco Park in June and an afternoon game at Coors Field in August might as well be different sports. I learned this the hard way during my second season of MLB betting when I treated every over/under as a pitching question and ignored where the game was being played.
Park factors quantify how much a specific venue inflates or suppresses scoring relative to the league average. A park factor of 110 means that ballpark produces about 10% more runs than a neutral environment. Coors Field regularly posts factors above 115 for runs, while pitcher-friendly parks like Tropicana Field and Oakland Coliseum sit below 95. You can find park factor tables on public baseball data sites updated throughout the season. I keep a spreadsheet that flags any game where the park factor deviates more than 8% from neutral — those are the matchups where totals pricing is most likely to contain error.
Temperature is the single most impactful weather variable for totals. Above 29 degrees Celsius, the ball carries farther because warm air is less dense. Research across multiple seasons shows that games played above that threshold produce roughly 0.5 more runs per game than the seasonal average. That half-run might not sound like much, but when a total is set at 8.5 and the implied expectation sits right on the line, half a run tilts the probabilities meaningfully.
Wind direction at the specific ballpark is the second variable. A 15-mph wind blowing out to centre field at Wrigley can add a full run to expected scoring. The same wind blowing in suppresses fly balls and turns potential home runs into long outs. I check park-specific wind forecasts two hours before game time, and if conditions have shifted dramatically from the morning forecast, I re-evaluate whether the total still represents value.
Humidity and altitude round out the picture. Denver’s thin air at 5,280 feet above sea level is the most famous example, but even parks at moderate elevation in places like Atlanta and Phoenix produce slightly inflated run environments compared to coastal venues at sea level. These adjustments are baked into the line to some extent, but not always accurately, especially early in the season when bookmakers are still calibrating their models to the year’s run environment.
Bullpen Depth and Its Effect on Late-Inning Scoring
Most bettors focus on starting pitchers when evaluating totals. That makes sense — the starter typically covers five or six innings. But the late innings are where totals bets are won and lost, and that is bullpen territory.
A team with a deep, rested bullpen can protect a lead and suppress scoring from the sixth inning onward. A team running on fumes — maybe they played a 13-inning game the night before and burned through four relievers — is far more likely to leak runs late. I track bullpen usage over rolling three-day windows. If a team’s top three relievers have all thrown 25 or more pitches in the previous 48 hours, I mark that bullpen as compromised and give the over a closer look.
Closer availability is particularly relevant for totals set at whole numbers or tight half-run lines. A dominant closer who is rested and available can be the difference between an 8-7 game and a 9-7 game — which is the difference between a push and a loss on a total of 8.0, or a win and a loss on 8.5. Teams that deploy a bullpen-by-committee approach rather than a designated closer add another layer of uncertainty, which generally favours the over.
One pattern I have noticed over the years is that totals value shifts as the season progresses. In April and early May, pitchers are typically fresher and bullpens are at full depth, which tends to suppress scoring. By August and September, fatigue accumulates, rosters expand, and run environments inflate. Tracking this seasonal arc and comparing it to how quickly the bookmakers adjust their baseline totals is one of the quieter edges in MLB beat bets — and one that rewards patience more than any single-game analysis ever could.
