

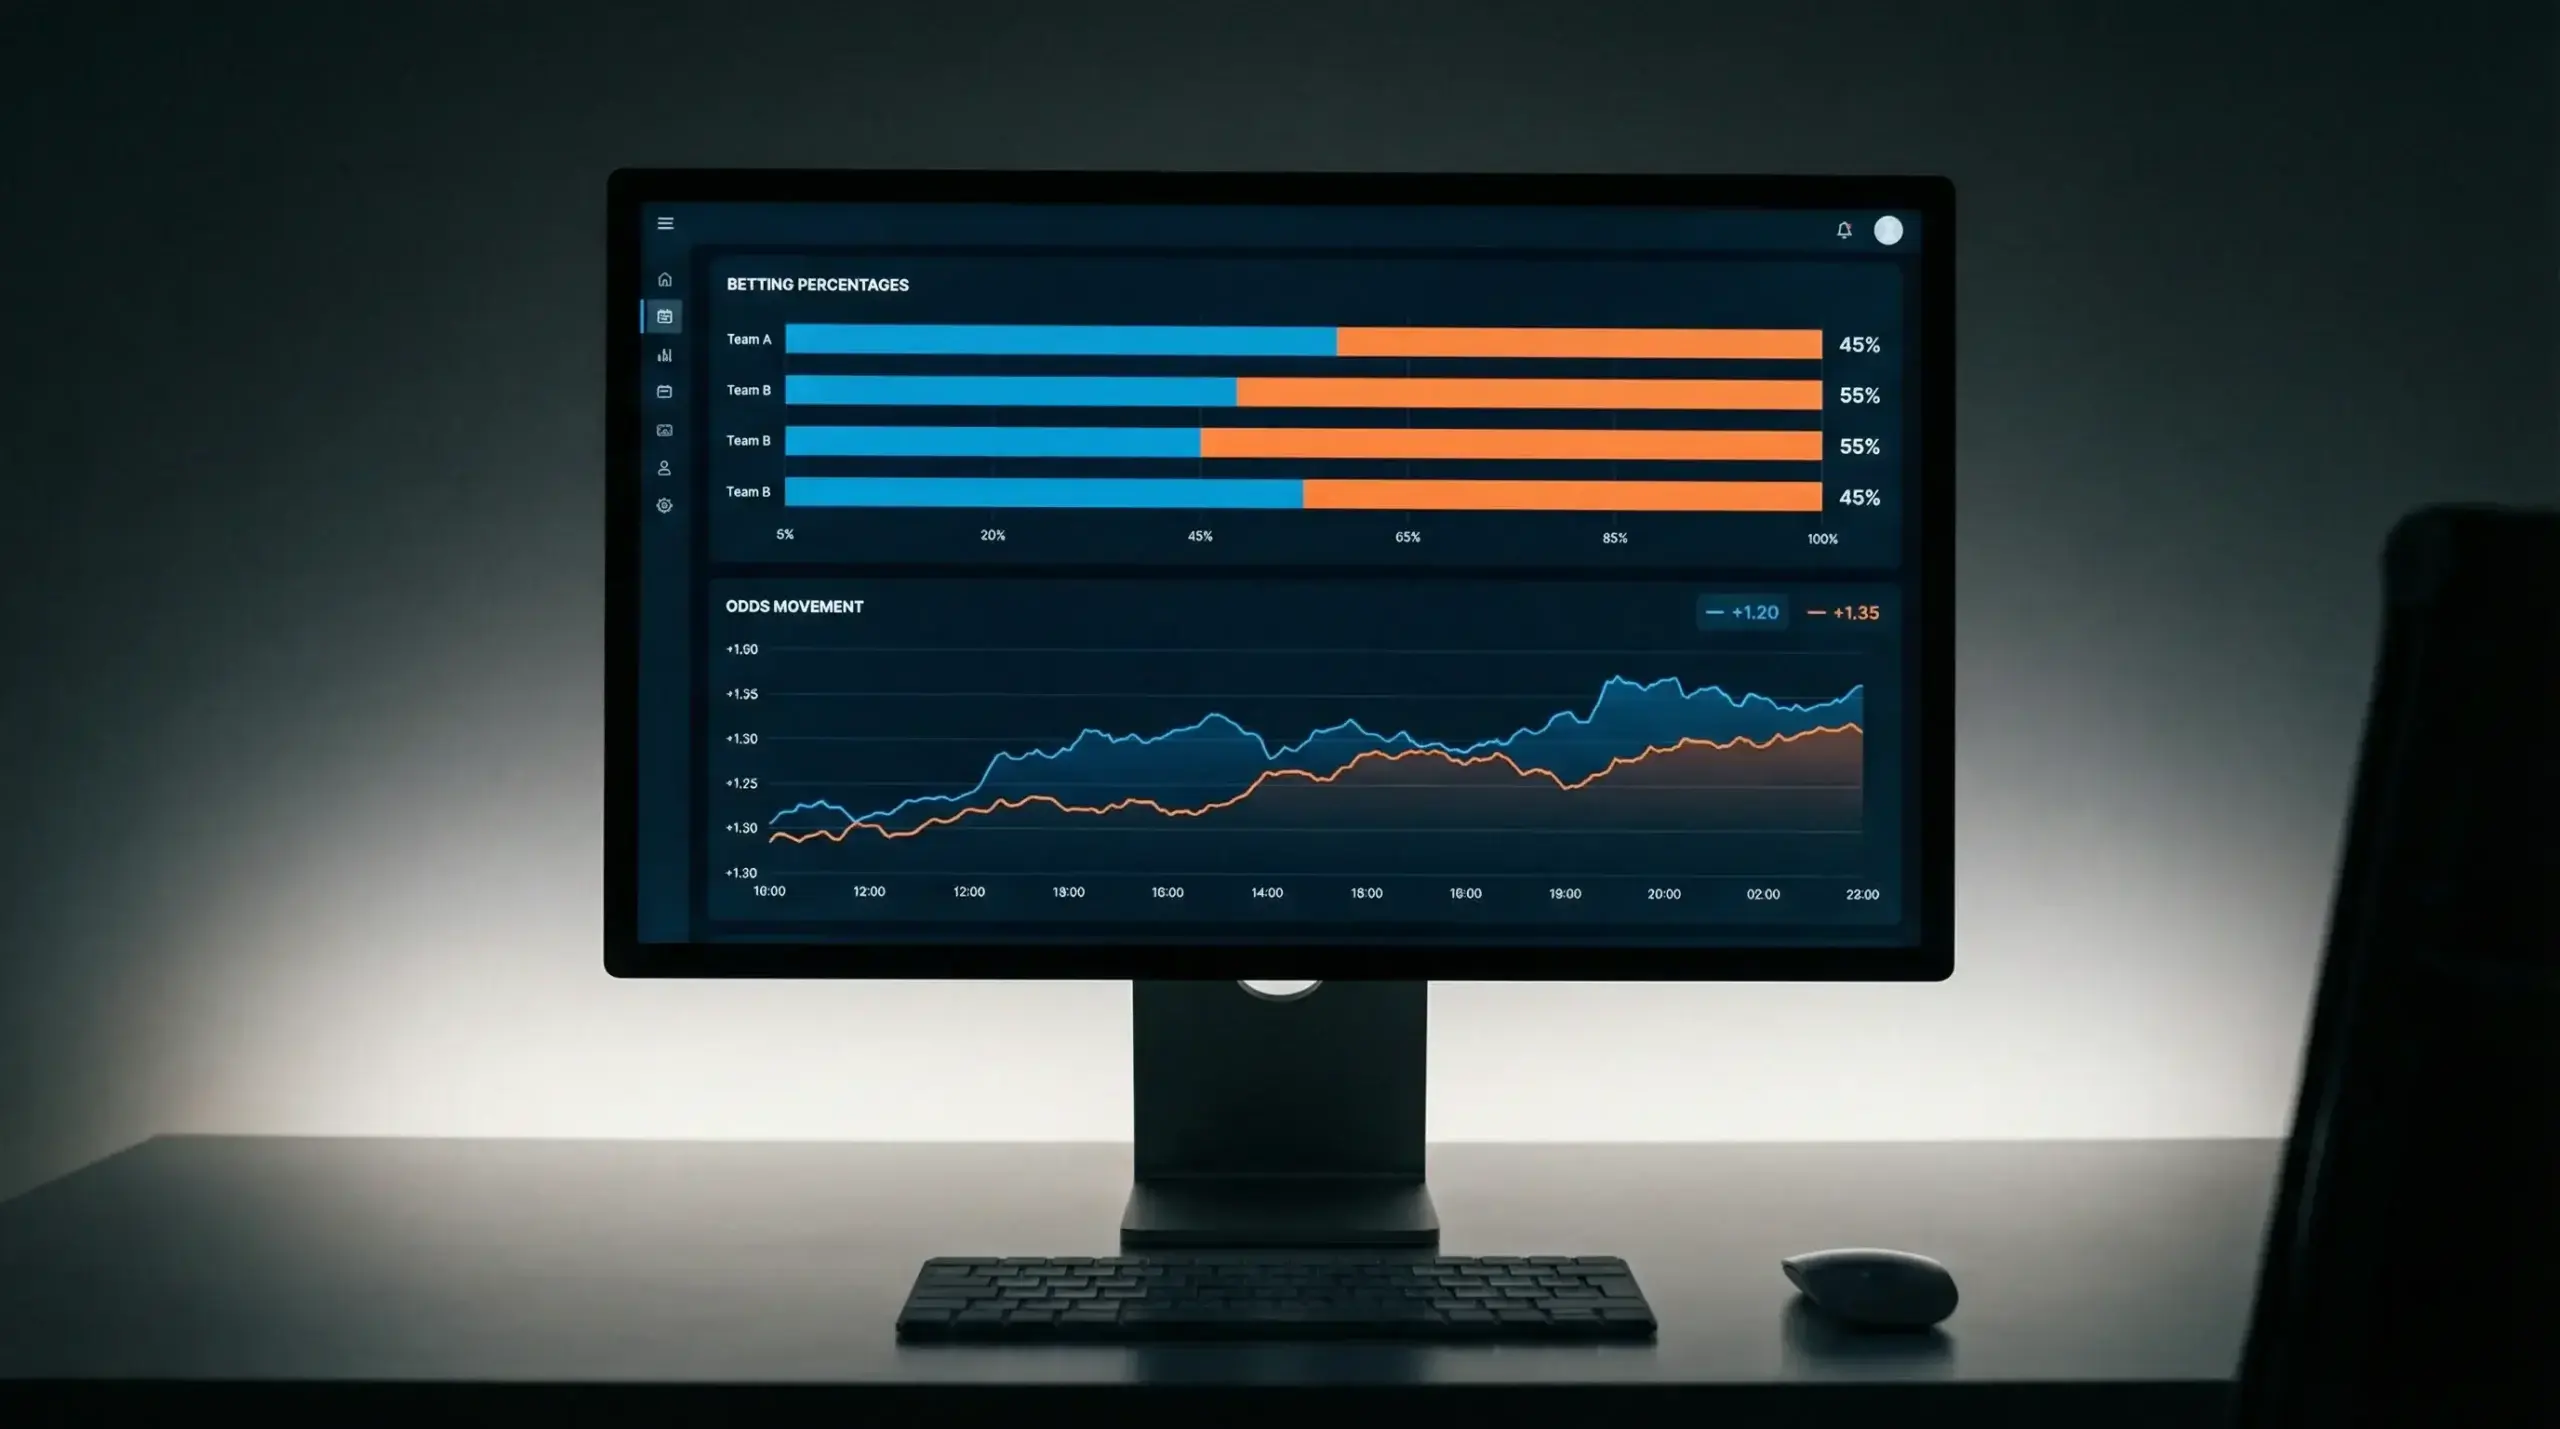
I once watched a game where 78% of public bets were on the favourite, and the line moved in the opposite direction — toward the underdog. That single moment changed how I think about MLB markets. It was the first time I truly understood that the number of bets placed and the amount of money wagered are two completely different signals, and reading them correctly is one of the most undervalued skills in baseball betting.
Public betting data shows you which side the majority of recreational bettors have chosen. It does not tell you which side is right. In the UK, roughly 290 million online bets are placed every month across all sports. MLB absorbs only a sliver of that volume compared to football, which means the baseball-specific betting public is smaller, sometimes less informed about the sport, and more prone to surface-level biases that create systematic mispricings.
What Public Betting Percentages Actually Measure
The number that most sites display — “72% of bets on Team A” — counts tickets, not pounds. If 1,000 people each bet GBP 10 on Team A and one sharp bettor places GBP 50,000 on Team B, the public percentage says 99.9% on Team A while the actual money is split almost evenly. This distinction is everything.
Public betting percentages are derived from a sample of sportsbooks that share their data, not from the entire global market. The numbers you see on free consensus sites represent a snapshot, not the full picture. Different data providers report slightly different percentages because they pull from different operator pools. I use public data as a directional indicator, never as a precise measurement. If three separate sources all show 70%+ on one side, that convergence is meaningful. If one source says 65% and another says 52%, the signal is too noisy to act on.
The practical value of public percentages is in identifying lopsided sentiment. When the public overwhelmingly backs one side, the bookmaker has two choices: adjust the line to attract money on the other side, or accept the imbalance and profit if the public side loses. MLB bookmakers frequently choose the second option because they have learned that heavy public sides in baseball lose often enough to be profitable for the house. That pattern is the foundation of contrarian betting.
Reverse Line Movement and When It Matters in MLB
Reverse line movement — where the line moves against the side receiving the majority of public bets — is the single most discussed concept in contrarian betting. It deserves the attention, but it also deserves more nuance than most guides give it.
Not every instance of reverse line movement is a sharp signal. Lines also move because of injury news, weather updates, or lineup changes that have nothing to do with betting action. A starting pitcher scratched from the lineup thirty minutes before first pitch will cause dramatic line movement regardless of where the money is. I always check the context before attributing line movement to sharp action. If no material news has broken and the line is moving against public sentiment, the probability that sharp money is driving the move increases significantly.
The US sports betting market handled roughly £165 billion in wagers in 2025. MLB’s share of that handle is substantial during the baseball season, and the sheer volume means line movement can be rapid and efficient. For UK bettors watching lines during late evening BST hours, this creates an interesting dynamic: much of the sharp action hits US books between 4-6 PM Eastern time (9-11 PM BST), which is right when most UK bettors are settling in for the night’s games. If you monitor line movement during that window, you can observe sharp action in near-real-time and adjust your bets accordingly.
I keep a simple log: for each game, I note the opening line, the closing line, the public percentage, and whether there was any notable news. Over a season, this log reveals which types of games produce reliable reverse line movement patterns and which are just noise. The discipline of logging forces me to evaluate each signal on its merits rather than chasing every contrarian angle that appears on a screen. Contrarian betting works in MLB — the data supports it over large samples — but it works because of selective application, not blanket fading. That selectivity is what separates a viable MLB betting strategy from a contrarian gimmick.
