

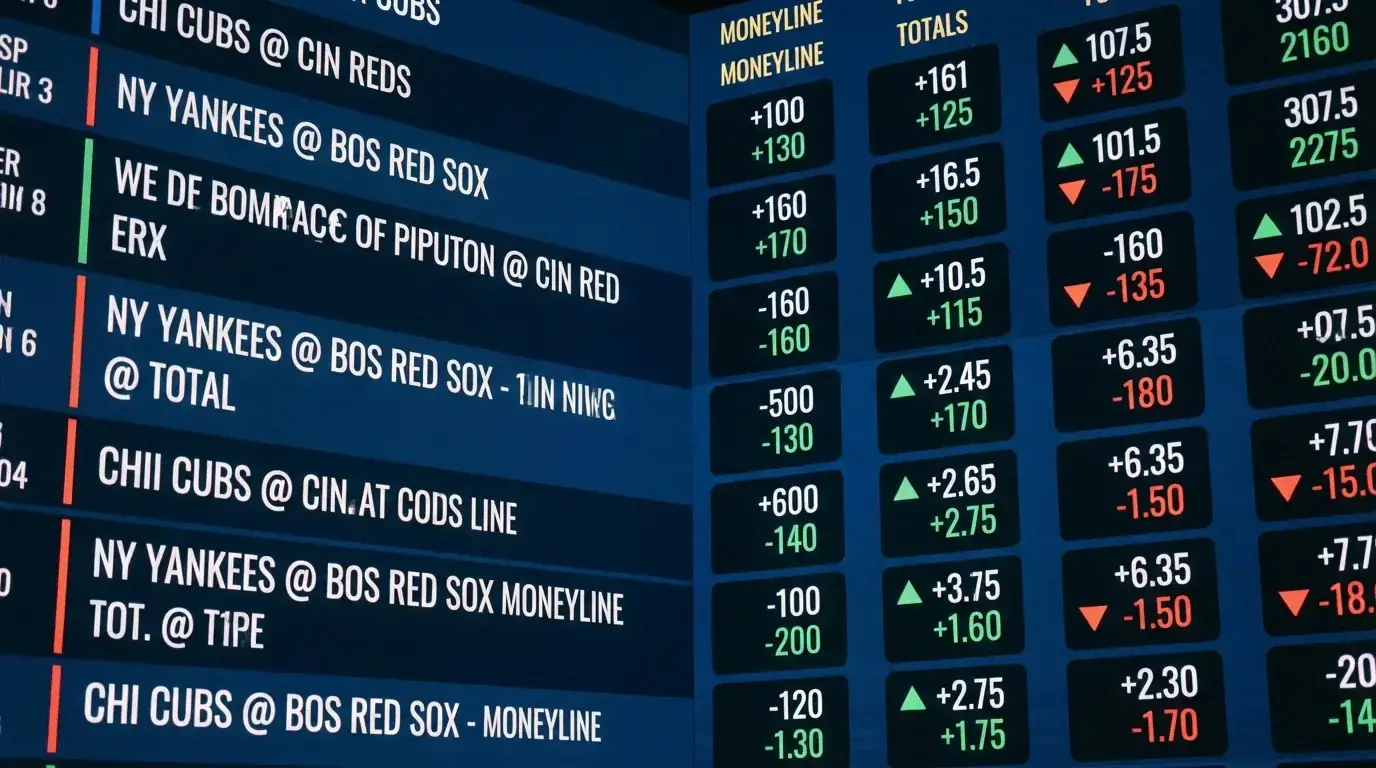
Before you can exploit a price, you need to understand how it was built. MLB odds are not plucked from thin air or generated by a single algorithm. They are a product of mathematical models, market forces, and commercial strategy, layered together and adjusted continuously from the moment the line opens until the first pitch is thrown. I spent my first two MLB seasons treating odds as fixed numbers to either accept or reject. Once I started studying how lines are constructed and why they move, I began seeing the market as a dynamic system with exploitable patterns rather than a static menu of prices.
From Power Ratings to Opening Lines: How Bookmakers Price MLB
Every major sportsbook maintains a set of power ratings — numerical rankings that quantify each MLB team’s strength on a given day. These ratings incorporate recent performance, roster composition, starting pitching, bullpen health, and other variables. The exact formula is proprietary and varies between operators, but the principle is universal: the bookmaker compares the power ratings of two teams, adjusts for the ballpark and the starting pitcher matchup, and generates a raw line that represents their initial estimate of each team’s win probability.
That raw line is not what you see when the market opens. Before posting, the odds department adjusts for anticipated public action. If the model says Team A should be 1.75 but the operator knows Team A is a public darling — maybe they are the Yankees on national television — the opening line might be shaded to 1.70 to account for the flood of recreational money that will land on Team A regardless of the price. The bookmaker is not just predicting the game; they are predicting the market’s behaviour.
The US sports betting market processed approximately £165 billion in total handle during 2025, and MLB’s share during the baseball season is substantial. That volume means opening lines at major US books are set by some of the sharpest pricing teams in the industry. UK bookmakers often reference these US opening lines and adjust for their own customer base and risk tolerance. The result is that MLB odds at UK operators generally shadow the US market with a slight lag and slightly wider margins.
Understanding this chain — power ratings to raw line to shaded opening — tells you something important: the opening line is a starting point for a negotiation between the book and its customers, not a fixed assessment of probability. The value you find in an opening line might come from the shading itself, or it might appear later as the line moves in response to betting action.
Injuries, Weather, and Money: Three Forces That Move MLB Odds
I once backed a team at 2.10 in the morning and watched the line shorten to 1.85 by game time. No injury news, no weather change, no lineup surprise. The line moved purely because sharp bettors loaded up on the same side. That 0.25-point swing represents a massive shift in implied probability — from 47.6% to 54.1% — and it happened in the space of eight hours.
Money is the most common driver of line movement. When a sportsbook receives a disproportionate amount of action on one side, it adjusts the line to attract bets on the other side and balance its liability. Sharp money — large wagers from known professional bettors — moves lines faster than public money because bookmakers respect the information embedded in sharp action. In the UK, roughly 290 million online bets are placed monthly across all sports, but MLB’s share is small enough that individual sharp wagers can have an outsized effect on the line.
Injuries are the second force. A starting pitcher scratched from the lineup 90 minutes before first pitch can move the moneyline by 20-30 cents in seconds. Position player injuries have a smaller but measurable impact, especially when the absent player bats in the top third of the order. The speed of line adjustment depends on the book — US-facing operators adjust almost instantly, while some UK operators take a few extra minutes, creating a brief window of stale pricing that alert bettors can exploit.
Weather is the third force, and it primarily affects totals rather than moneylines. A wind forecast that shifts from “blowing in” to “blowing out” at Wrigley Field can move the total by a full run. Temperature changes, rain delays, and roof decisions at retractable-roof stadiums all contribute. I check weather twice: once in the morning when I preview the slate, and once two hours before first pitch when conditions stabilise.
Reading the Juice: What the Vigorish Tells You
The vigorish — commonly called “the vig” or “the juice” — is the bookmaker’s built-in profit margin. In a perfectly balanced market with no edge to either side, the bookmaker would price both outcomes at 2.00 (even money). Instead, they price them at something like 1.91 on each side, creating a combined implied probability of 104.7%. That extra 4.7% is the juice.
Juice tells you two things. First, the overall margin on a specific market. MLB moneylines at sharp US books typically carry 3-4% juice. UK operators often run 4-6% on MLB because the market is lower-volume and less competitive. Higher juice means you need a larger edge to be profitable. Second, the distribution of juice across the two sides tells you which direction the book is shading. If one side is 1.80 and the other is 2.15, the juice is not evenly split — the book is offering a better price on the 2.15 side to attract action and balance exposure.
I compare juice across three or four UK operators before every bet. A difference of 2-3% in margin on the same game is common, and over a full season, consistently finding the lowest-juice line on your bets is equivalent to a significant reduction in the house’s advantage. It is not flashy work — it is spreadsheet work, the kind of grinding edge that separates sustainable MLB betting from casual punting.
