

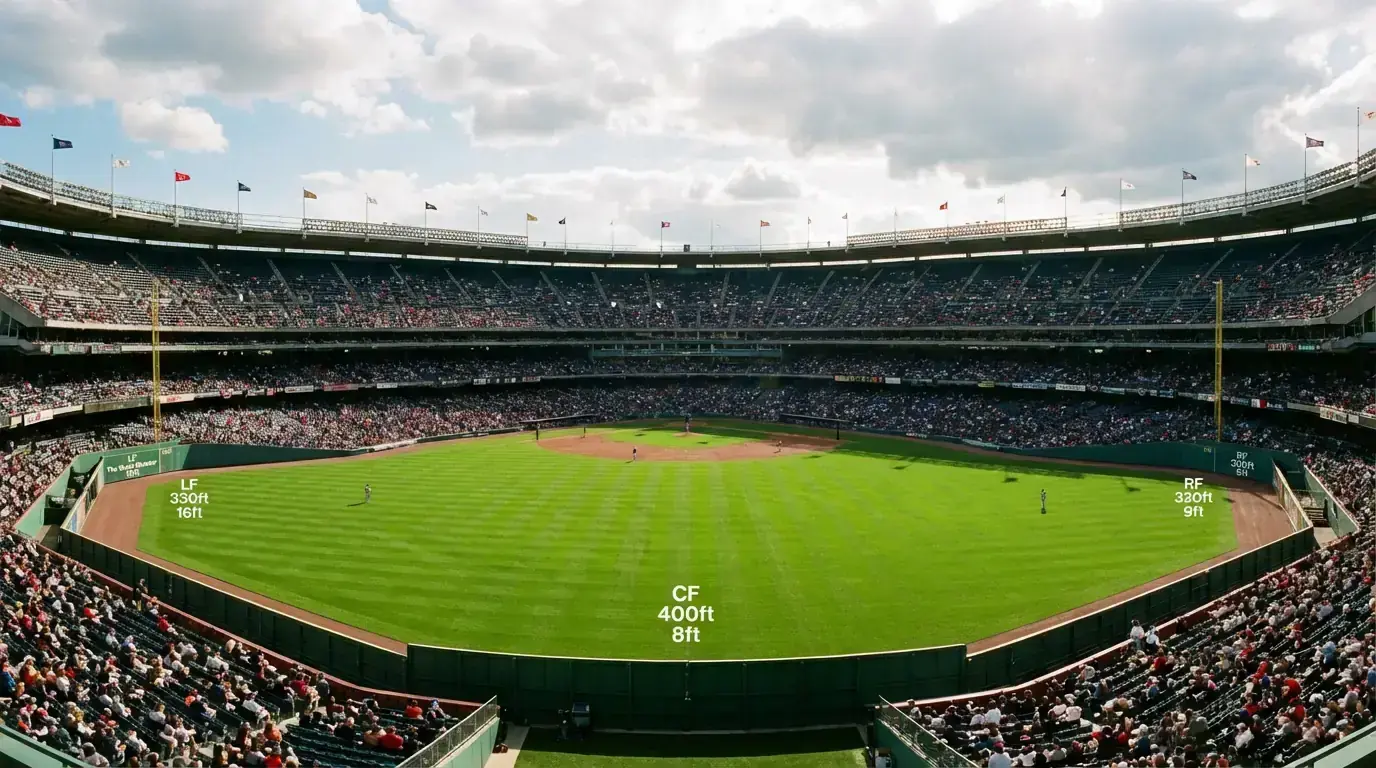
In football, the pitch is the pitch. Standardised dimensions, standardised surface — maybe the grass is a bit longer at some grounds, but the playing field is functionally the same everywhere. Baseball is different. Every ballpark in MLB has unique dimensions, unique wall heights, unique foul territory, and sits at a unique altitude in a unique climate. This is not a cosmetic quirk. It is a structural variable that moves betting lines, inflates or suppresses scoring, and creates pricing errors that sharp bettors exploit every single day of the season.
What Park Factor Means and How It Is Calculated
I spent my first full MLB season ignoring park factors because they seemed like a minor adjustment. By August, I had lost a noticeable chunk of bankroll on totals bets at hitter-friendly parks that I kept treating as neutral venues. That was the season I built park factors permanently into my process.
A park factor is a number, centred on 100, that quantifies how much a specific ballpark inflates or suppresses a particular outcome relative to the league average. A park factor of 110 for runs means that venue produces about 10% more runs than a neutral environment. A factor of 92 means 8% fewer runs. The calculation compares a team’s home scoring environment (runs scored and allowed at home) against their road scoring environment (runs scored and allowed away) over a multi-season sample.
Single-season park factors are volatile because they include small samples and weather anomalies unique to that year. I use three-year rolling park factors as my baseline and then adjust for any known structural changes — a wall height modification, new dimensions, or a roof addition. Some public baseball data sites publish updated park factors monthly during the season. I cross-reference at least two sources before trusting a number.
Park factors are calculated for multiple outcomes: runs, home runs, hits, doubles, triples, and strikeouts. For totals betting, the runs factor is the headline number. For player props, the home run factor and strikeout factor become more relevant. A park that suppresses home runs but inflates doubles creates a different betting environment from one that inflates home runs across the board.
Temperature, Wind, and Humidity: The Thresholds That Move Totals
Weather is the dynamic layer on top of the static park factor, and it is the variable that bookmakers adjust for last, which means it is the variable most likely to contain exploitable error.
Temperature is the dominant factor. Warmer air is less dense, so the baseball travels farther on contact. The threshold I have identified through tracking four years of game-level data sits at roughly 29 degrees Celsius. Games played above this temperature produce approximately half a run more than the seasonal average at the same venue. Below 10 degrees Celsius, scoring drops by a similar margin. The effect is not linear — it accelerates at the extremes. A 35-degree day at a hitter-friendly park is a totals goldmine; a 5-degree April night at a pitcher’s park suppresses scoring dramatically.
Wind is the second variable, but direction matters far more than speed. A 15-mph wind blowing straight out to centre field can add a full run to expected scoring by carrying fly balls over the fence that would otherwise be caught at the warning track. The same 15-mph wind blowing in from centre field suppresses scoring by knocking down those same fly balls. Crosswinds are largely neutral for totals purposes, though they can create quirky single-game outcomes. I check park-specific wind forecasts roughly two hours before game time, once conditions have stabilised. The average game duration of about 2.5 hours means conditions at first pitch are a reasonable proxy for the full game, though late-afternoon starts can see wind shifts as temperatures drop in the evening.
Humidity is the subtlest variable and the one most bettors either ignore or misunderstand. Common sense says humid air is “thicker” and should suppress ball flight. Physics says the opposite: water vapour is lighter than nitrogen and oxygen, so humid air is actually less dense and the ball carries marginally farther. The effect is real but small — perhaps a tenth of a run on average. I treat humidity as a confirmation signal rather than a primary driver. If temperature and wind already point toward the over, high humidity adds a small nudge in the same direction.
The Five Most Extreme MLB Ballparks for Bettors
After years of tracking park-adjusted results, five venues consistently stand out as environments where the standard assumptions break down.
Coors Field in Denver is the most extreme outlier in professional sport. At 5,280 feet above sea level, the thin air reduces drag on the baseball by roughly 9% compared to sea level, and breaking pitches lose movement because the thinner air provides less resistance. Coors consistently posts a park factor above 115 for runs, and home run rates there run 30-40% above league average. Totals lines at Coors are set higher than anywhere else, but the market still underestimates the variance — Coors games produce more blowouts and more unexpected scoring patterns than any other venue.
Oracle Park in San Francisco sits at the opposite extreme. Cold marine air rolling in off the bay, especially during evening games, suppresses ball flight and chills hitters. The park factor for runs hovers around 90-93, and the home run factor is even lower. Unders at Oracle Park have been a quiet profit centre in my portfolio for years.
Fenway Park in Boston features the Green Monster — a 37-foot wall in left field that turns would-be home runs into singles and doubles off the wall. This quirk inflates hits and doubles but does not inflate home runs as much as the overall run factor suggests. For player prop bettors, Fenway is a park where total bases props behave differently from home run props.
Yankee Stadium in the Bronx has a notoriously short right-field porch — 314 feet down the line. Left-handed pull hitters feast there, and the home run park factor regularly exceeds 110. When a left-handed power hitter faces a right-handed pitcher at Yankee Stadium, the home run probability spikes well above the league baseline.
Great American Ball Park in Cincinnati rounds out the list. A compact outfield, warm Midwestern summers, and relatively low altitude combine to create a run-friendly environment that does not get the attention Coors receives. The park factor for runs sits around 108-112, making it a less dramatic but more consistently exploitable venue for totals bettors who are looking beyond the obvious Coors adjustment. Factoring parks into every bet is a fundamental part of any serious MLB betting approach, and ignoring them is the fastest way to donate your bankroll to the bookmaker.
