

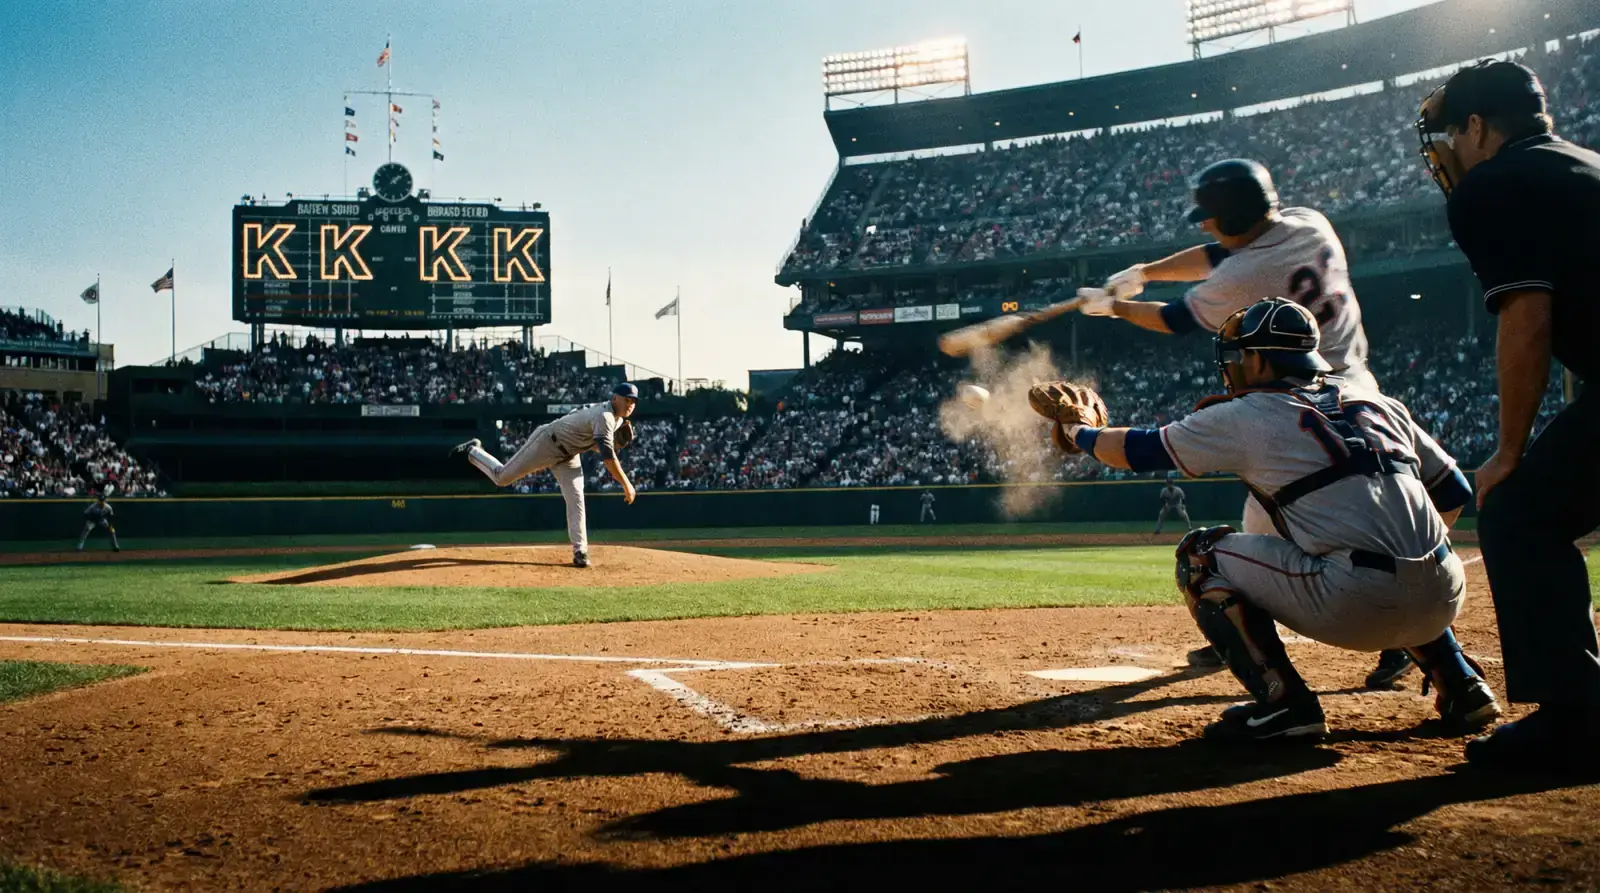
Strikeout props are the bread and butter of my MLB player prop portfolio. Unlike home run props, which depend on a single event that might not happen, strikeout props deal in accumulation — does a pitcher record 5, 6, 7, or more strikeouts in a start? The volume of relevant data points per game is much higher, which makes modelling more reliable and the market more exploitable for a bettor willing to do the matchup-level homework.
I began tracking K props seriously in 2021 and have placed over 800 individual strikeout bets since then. The lessons are clear: the market prices K props reasonably well for elite pitchers but consistently misprices them for mid-tier starters facing lineup-specific matchups. That middle tier is where I find most of my value.
K%, Swinging Strike Rate, and Chase Rate Explained
Three metrics form the foundation of any strikeout prop analysis. Each measures a different aspect of a pitcher’s ability to generate Ks, and all three are needed to form a complete picture.
K% — strikeout rate — is the percentage of plate appearances that end in a strikeout. It is the top-line number and the easiest to interpret. The league average K% for starters sits around 22-23%. Pitchers above 27% are elite strikeout artists; below 18%, they are contact managers who rely on induced weak contact rather than whiffs. For prop betting, I look for starters with a K% above 25% as my primary filter because the strikeout volume is high enough to consistently challenge the prop line.
Swinging strike rate — SwStr% — measures how often a pitcher’s offerings generate swings and misses. This is the most process-oriented metric of the three because it tells you about the quality of the pitcher’s stuff independent of count, situation, or umpire. A SwStr% above 12% indicates pitches that are genuinely difficult to make contact with. Above 14%, you are looking at a pitcher whose stuff generates empty swings at an elite rate. SwStr% is more stable than K% over small samples, making it particularly useful early in the season when K% data is thin.
Chase rate — O-Swing% — measures how often batters swing at pitches outside the strike zone. A pitcher who induces a high chase rate is expanding the zone effectively, getting hitters to swing at unhittable pitches. But chase rate is a two-sided coin: it depends as much on the opposing lineup’s discipline as on the pitcher’s ability to deceive. This is where the matchup-specific analysis begins.
Matching Pitcher Strengths Against Lineup Weaknesses
A pitcher’s season-long K% tells you what he does on average. Against a specific lineup, the reality can differ substantially. This divergence is the core of K prop betting.
Across 2,430 regular-season MLB games, lineup composition varies enormously from night to night. A team might stack left-handed hitters against a right-handed pitcher one day and deploy a right-heavy lineup the next. Each configuration creates a different K probability for the pitcher. I evaluate the projected lineup’s collective K% against starters with similar pitch profiles to the one I am analysing. If the lineup typically strikes out at 26% against right-handed power pitchers and tonight’s starter is exactly that profile, I use that matchup-specific K% rather than the pitcher’s blanket season number.
Platoon splits add another layer. Left-handed batters generally strike out less against left-handed pitchers than right-handed batters do, but the direction and magnitude depend on the specific pitcher’s pitch mix. A lefty who throws a devastating slider to right-handed batters might have an inflated K% against righties and a suppressed K% against lefties. If the opposing lineup is heavy on left-handed hitters, the prop line based on overall K% might be too high.
Pitch count context matters too. A pitcher who averages 5.5 innings per start faces roughly 22-24 batters, giving him 22-24 opportunities to record strikeouts. If his K% is 27%, you would expect about 6-6.5 Ks per start. But if the opposing lineup is patient and works deep counts, the pitcher’s pitch count rises faster, he exits earlier, faces fewer batters, and his K total drops even if his per-batter K rate remains the same. Projected game length and pitch efficiency should always factor into your K prop analysis.
When to Take the Over vs Under on Strikeout Lines
My default approach leans toward overs because the upside is uncapped — a pitcher can strike out 12 or 13 batters in a dominant start, but the downside on a bad day is capped at zero. That asymmetry slightly favours the over on lines that are set near the pitcher’s expected output.
That said, unders have their spots. The best K under situations involve a pitcher facing a lineup with very low chase rates and strong plate discipline. If the opposing team ranks in the bottom quartile for K% against the pitcher’s handedness, the K line may be set based on the pitcher’s overall numbers while the actual matchup suppresses strikeouts. I also take unders when a pitcher is returning from a minor injury and is likely on an informal pitch count that caps his outing at five innings, reducing the total opportunities.
Weather can nudge K props in subtle ways. In extreme cold, hitters’ bat speed decreases marginally and pitchers’ grip on breaking balls can be affected. Cold-weather games tend to produce slightly more strikeouts because both hitters and pitchers are less precise, and imprecision favours Ks over balls in play. It is a marginal effect — perhaps half a strikeout on average — but on a line set at 5.5, that half-strikeout is the difference between a bet and a pass. Every edge is marginal in MLB betting, and strikeout props are no exception.
